①
Billable hours vs plan, last 24 months
HoursBillable hours, selected periodBillable hours, outside periodPlan
②
What this board answers
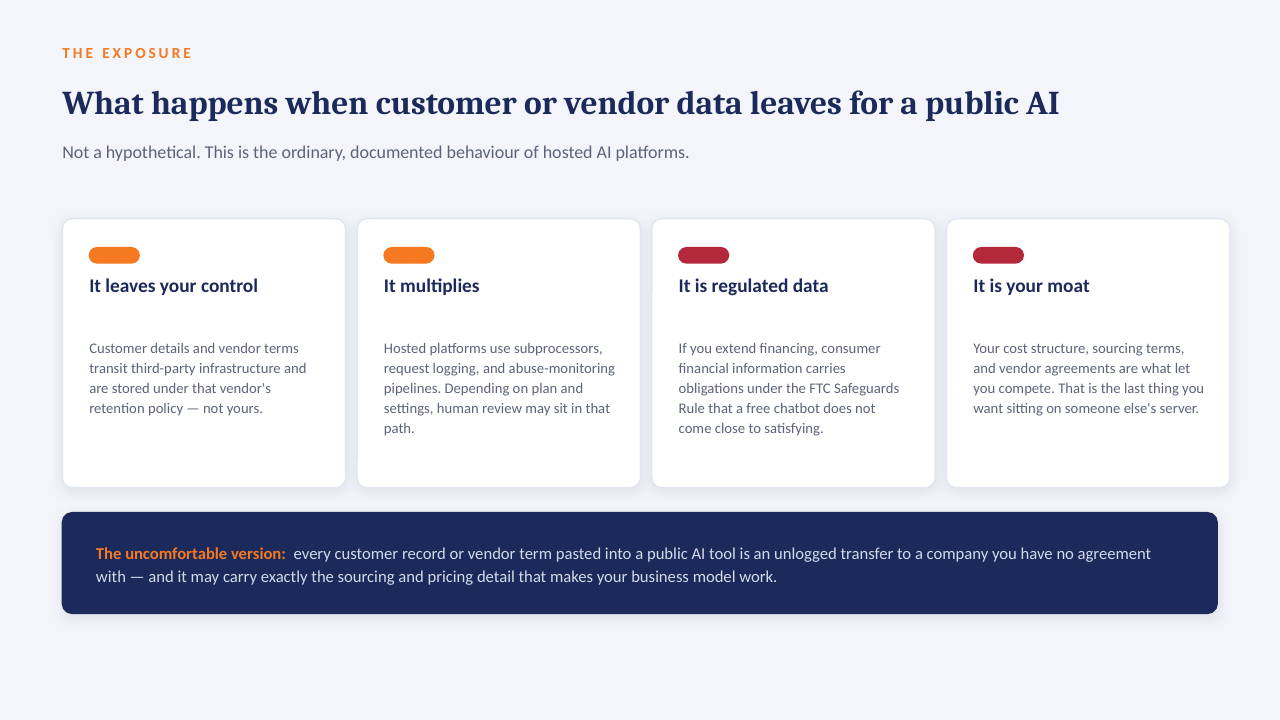
Three questions⑩
Lock-up river: work in progress → debtors → cash
Days · width = billings per dayWork in progress (unbilled)Debtors (billed, uncollected)Selection average lock-upWrite-down at the billing weir
④
Utilisation & realisation by practice
vs planUtilisationPlanned utilisation
Util.Real.
③
Partner × client allocation grid
Billable hours in period⑤
Revenue & margin by client
Fees · marginClient · sectorFeesMargin
⑥
Pipeline by stage
Opened in period⑦
Invoice ageing
Period end⑧
Client concentration
Share of fees⑨
Ask the data
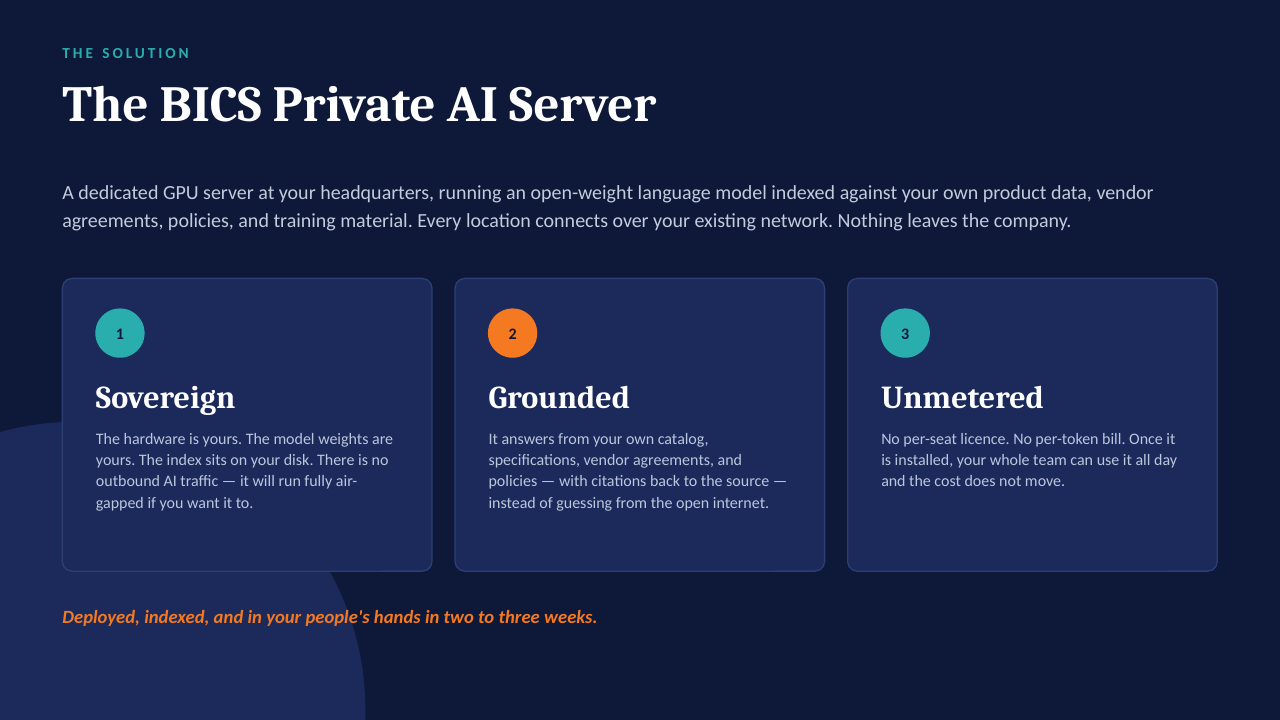
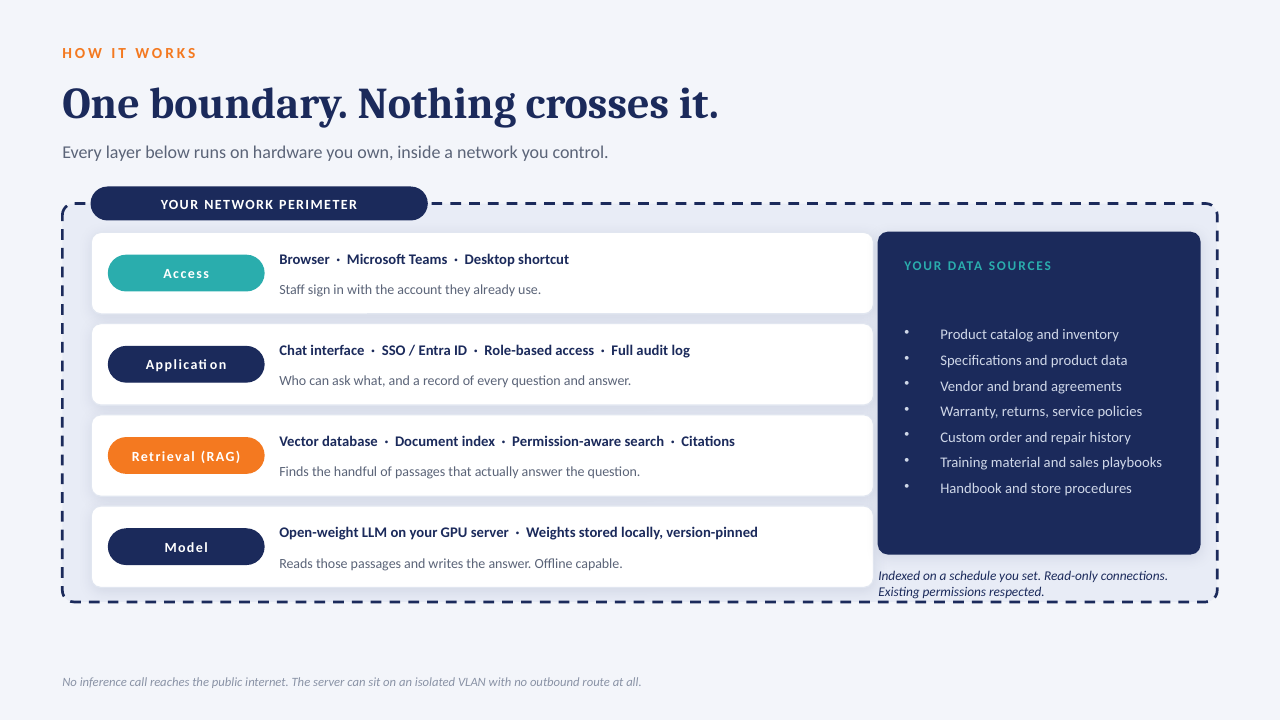
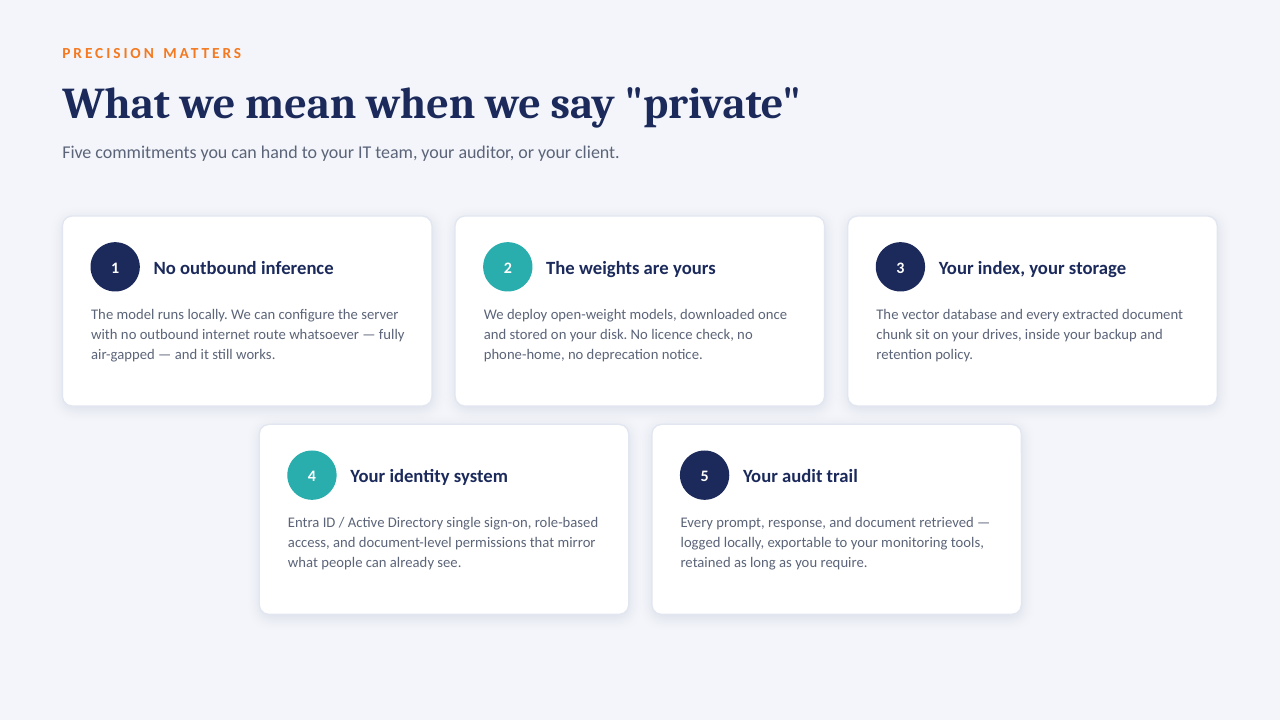
AI layer · answers grounded in this boardYouWhich practice's lock-up got worse this period, and how much cash would bringing it back to the firm average release?
Other questions partners ask this board
Which clients are below 15% margin?
Who bills the most hours to a single client?
How many months of revenue does the pipeline cover?
Where did write-downs increase this quarter?
Which office is furthest under plan?
⑪
1 Benchmark: SPI Research, 2026 Professional Services Maturity Benchmark (19th annual), reports average billable utilisation of 66.4% across surveyed professional-services organisations for 2025 — the lowest in the survey's history and below the 75% target (spiresearch.com; figures as summarised by Deltek). This board's utilisation KPI is compared against that published figure. Every other number on this page is illustrative sample data generated for demonstration, internally consistent (subtotals reconcile, percentages match the values shown) and does not describe any real firm or client. Practice cost rates include fee-earner salary and on-costs only; margin is before overhead and partner distributions.